


")


By Haddon Libby
“It was the best of times, it was the worst of times, it was the age of wisdom, it was the age of foolishness…” Dickens’ words from A Tale of Two Cities could have easily been written about 2018. The U.S. economy posted its best results in fifty years, yet the stock market posted its worst year in a decade. Does that make sense? Then again, would any of us have thought that we would be saying President Donald J. Trump twenty-five years ago?
Negative returns in 2018 were less than one-third of 2017’s positive results yet human nature is such that we feel the pain of the Christmas Correction of 2018 far more than benefits of a great 2017.
 To help you keep all of this in perspective, even if you had just invested your life’s savings in the stock market just before the crash in 2008, you still could have more than doubled their stock market investments over the last ten years. The trick to doubling your money was to have stayed invested. Despite the historic crash of 2008 and the Christmas Correction of 2018, you would have still more than doubled your money.

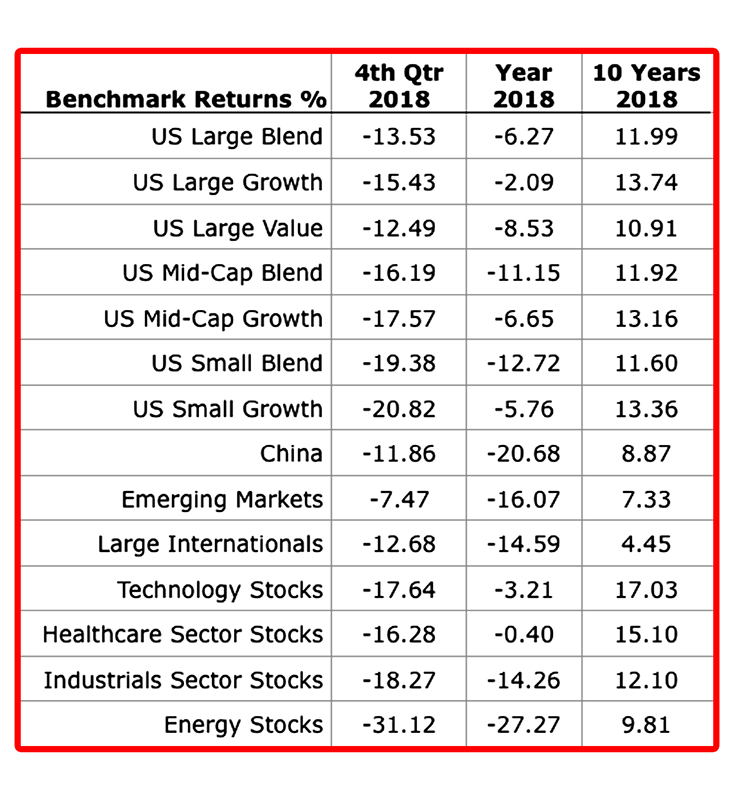
Whether you invest through a company retirement account or on your own, regularly compare your returns to market averages. Comparing performance to market averages is often referred to as benchmarking and is a critical component to any good investment strategy.
Two market averages that most of us know are the Dow Jones Industrial Average and the S&P 500. For 2018, the Dow lost 6.0% while the S&P 500 was off 4.4%. Each of these indexes give us a nice glimpse as to the performance of the stocks that comprise each index although neither represent what most have in their investment portfolios. As an example, if you hold any international stocks, that performance would not be captured by either index.
If you want to know whether your investments are performing as expected, compare it to its appropriate benchmark. For example, a Large Cap Value fund is best compared against all large cap value funds as they exhibit difference characteristics than the Large Cap Growth funds or the S&P 500.
Compare your returns to those in the chart in this article to see if your investments are performing as expected.
Before you put away your statement, look at how much you have invested in an industry or market style. Are you over or under invested relative to market averages? For example, if Healthcare stocks represent 15% of the market, how much do you hold? If you aren’t sure, keep your percentages close to market averages.
Come join me on January 23rd from 9am to 10:30am at the Mary Pickford Theatre in Cathedral City as I will be the monthly speaker for the Greater Coachella Valley Chambers of Commerce and discussing what happened in the Stock and Bond Markets in 2018 and what to expect in 2019 and beyond. For more information, visit www.gcvcc.org or contact me at HLibby@WinslowDrake.com. Note: Data from Morningstar, Inc.


