


By Haddon Libby
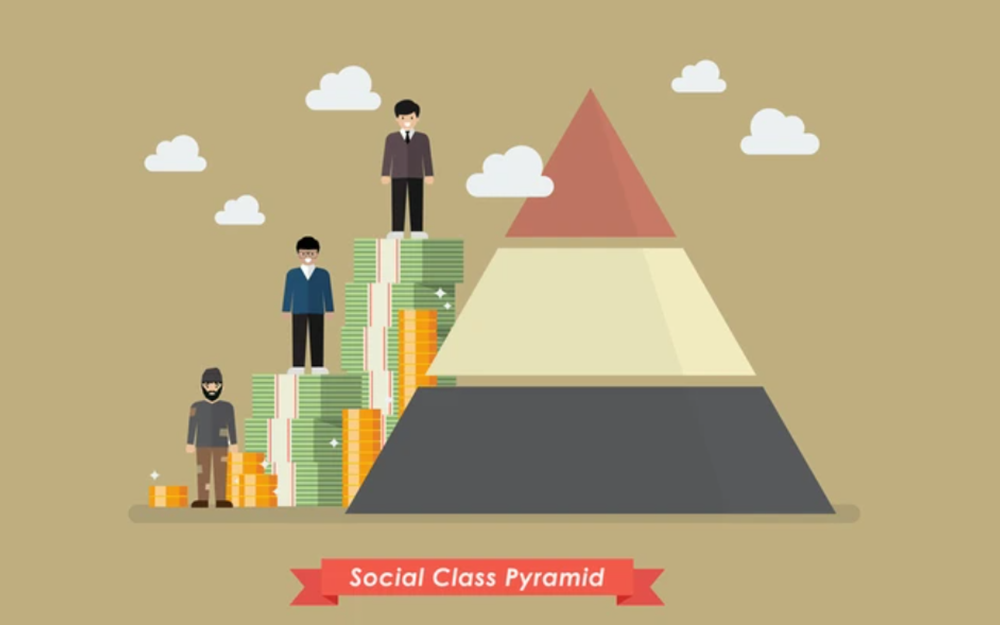
Who qualifies as financially rich?
The Pew Research Center tackled this question. Using 2022 Census Bureau information, Pew Research found that the median household income is $74,580. The median is where half of American households earn more, and half earn less.
Looking at income levels, a middle-class household earns between $58,000 and $94,000 each year. Lower middle class earns $30,000 to $58,000 while the upper middle class earns between $94,000 and $153,000. Half of all American households are considered middle-class, down 10% from fifty years ago.
Two in ten households are considered upper class with income of $153,000 or more while three in ten are in the lower class with income under $30,000/year.
Net worth is another measure to determine which households are in each economic class. To be considered amongst the upper class, household net worth needs to be above $800,000. Net worth is determined by adding up all assets and subtracting all debts.
The top 10% of households earned $323,000 and have a net worth of $2.7 million. These folks have $1.27 million of financial assets like stocks and bonds, $111,000 in checking accounts and $85,000 in bank CDs. This group pays $72,000 in taxes each year. Looking at the other half of the upper class, income averages $165,000, net worth is $790,000 and taxes are $22,000.
Overall, 45% of all income is earned by the 20% amongst the upper class. A deeper look shows that 9% of all income is earned by the top 0.1%. The top 1% earns 19% of all income while the top 5% earn 1/3rd of all income. This may be why tax proposals from Democrats target those earning more than $400,000/year or with a net worth of $100 million. In contrast, Republican tax cuts focus on the upper class.
A look at the upper middle-class households shows net worth levels at $269,000. Middle class families have $145,000, lower middle class $61,000 and lower class less than $12,000.
Education levels are a major factor in economic class.
Of those with at least a college degree. 35% are in the upper class, 52% in the middle class and 12% in the lower class. If we look at those with only a high school diploma, 9% are in the upper class, 54% in the middle class and 37% in the lower class. For those unable to finish high school, 54% are in the lower class, 52% in the middle class and just 5% in the upper class.
Medical debt is held by 24% of the middle class, 22% of the lower class and 13% of the upper class.
Over the last ten years, the middle class has found it increasingly difficult to afford a new car or home. Where the middle class can typically afford a $400/month car payment, the average payment on a new car is $737/month with a repayment period of 5 ½ years. When it comes to home ownership, just four in ten can afford to own a home. Looking at all economic classes, home ownership has fallen from 78% in 2010 to just under 70% today.
When it comes to saving for retirement, just 5% of Americans are on track to retire in comfort.
Here in Riverside County, we have 13% in the upper class , a level that is 50% below US averages. Our middle class is stronger at 56% (vs. 52% US average) while 31% are in the lower class, 10% above US averages.
Looking around the world, people do better in North America, the Eurozone, Australia and Russia. Places with the most poverty are in Africa, southern Asia, Central America and Bolivia.
Haddon Libby is the Founder and Chief Investment Officer of Winslow Drake Investment Management, an RIA firm that performs to the Fiduciary Standard. For more information on our services, please visit www.WinslowDrake.com.


