
 Celebrates 10th Annual AMP SUMMER CAMP MUSICAL EXTRAVAGANZA!")

")


’ TO FANTASY SPRINGS RESORT CASINO ON DEC. 6, 2024")


By Haddon Libby
When we talk about ‘the markets,’ most of us in the financial world think of the Dow Jones Industrial Average or the S&P 500.
The Dow averages a diversified mix of 30 American stocks in coming up with its average. This is a price scaled average index. Rather than get into advanced statistics, think of the index like this: if you bought all thirty stocks yesterday, the price increase or decrease is the amount higher or lower that mix of stocks would cost today. If the market is up 110 points that means that mix of stocks sold for 31,000 yesterday would sell for $31,210 today. Through August 15th, the Dow was up 16.1% for the year with a three-year average annual increase of 12.1%.
Where the Dow is a price scaled average, the Standard & Poor’s 500 (S&P 500) is market capitalization weighted. The index takes into account publicly-traded classes of stock (like GOOG and GOOGL for Alphabet). These five hundred companies represent roughly 75% of the net worth of all publicly-traded stocks in the United States. As the index is market weighted, a few mega-cap stocks make up an inordinate proportion of the performance of this index. At the end of July, the ten largest companies represented 27.7% of the indices market value. These stocks include Apple, Amazon, Microsoft, Facebook, Google, Tesla, Berkshire Hathaway, Nvidia and JP Morgan Chase and Visa. So far this year, the S&P 500 is up 19% with an impressive 16.6% increase.

As you can see, these indexes are calculated in an assortment of ways. Staying consistent with the S&P 500 is the Mid Cap S&P 400. This grouping of stocks is up 18.4% this year and 11.2% per year over the last three years. Stocks of a mid-cap size represent roughly 18% of market capitalization. Small-cap stocks are represented by the Small Cap S&P 600 represent 7% of the market. This grouping is up 20.6% this year and 8.5% over the last three years.
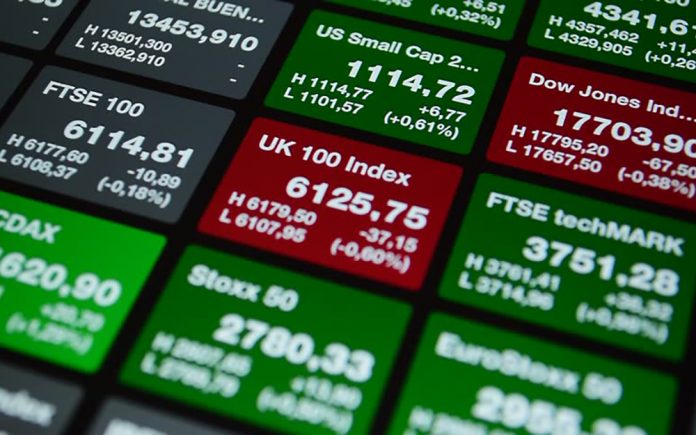
Looking around the world, the STOXX Europe 600 is up 19.2% for 2021. Looking inside of the Eurozone, the Swedish market is up 30.4% for the year. Mind you, the capitalization of the Swedish market is miniscule relative to the US, China or Germany. The German DAX is up comparably to the United States at 16.5% while the FTSE 100, a measure of stocks in the United Kingdom, is up 11.7%.
While public equities are rallying in most developed countries in the West, Asian markets are flat for the year. Australia and Taiwan have done best, up 15.8% and 15.3%, respectively with the small Malaysian market down 7.5%. The delta variant has hit Asian markets harder as the majority of vaccines distributed in this part of the world are not particularly effective against this strain of the disease. China is essentially flat on the year with the Shanghai index up 1.2% while the Hong Kong market is off 3.1%. Japan’s growth continues at an anemic 1.9% due to the ineffectiveness of their national vaccines that has proven to be as ineffective as the Chinese COVID jab.
Despite a record amount of money in the system, interest rates remain near historic lows. A five-year Certificate Deposit at most banks will provide a return of less than 1%. With inflation running at a 12% rate, this means that CD holders will lose 11% of their buying power in 2021.
The 30-year mortgage remains low at a 3.37% rate while the 15 year is at 2.71%. If you are buying a new car, the typical rate for a 48 month loan is 4.27%, as reported by Bankrate.com.
Haddon Libby is the Founder and Chief Investment Officer of Winslow Drake Investment Management. For more information, please visit www.WinslowDrake.com or email AClosner@WinslowDrake.com.


